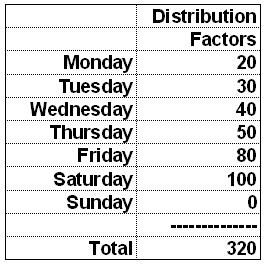
An “Impact Group” represents incidents within a period of time. In this example we will use the weekly budgeted sales of a super market. All the days within the week do not yield the same volume of sales. So, if we go to the company’s ERP system and run a query for the last 2 or 3 years, we can find the seasonality within the week. This hypothetical break down says that for every 100 EUR sold on Saturday, on average 20 EUR are sold on Monday etc.
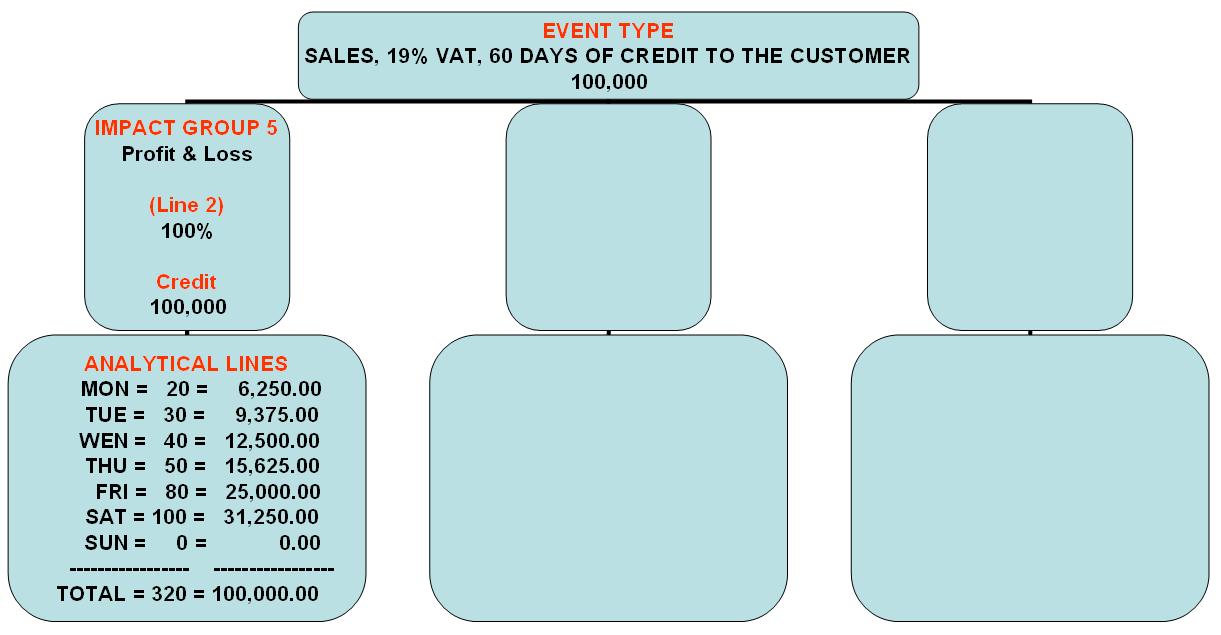
Since we must distribute 100,000.00 EUR within the days of the week, these distribution factors that the query showed us, are the basis for performing the break down. Monday’s sum is calculated in the following manner:
100,000.00 * 20 / 320 = 6,250.00
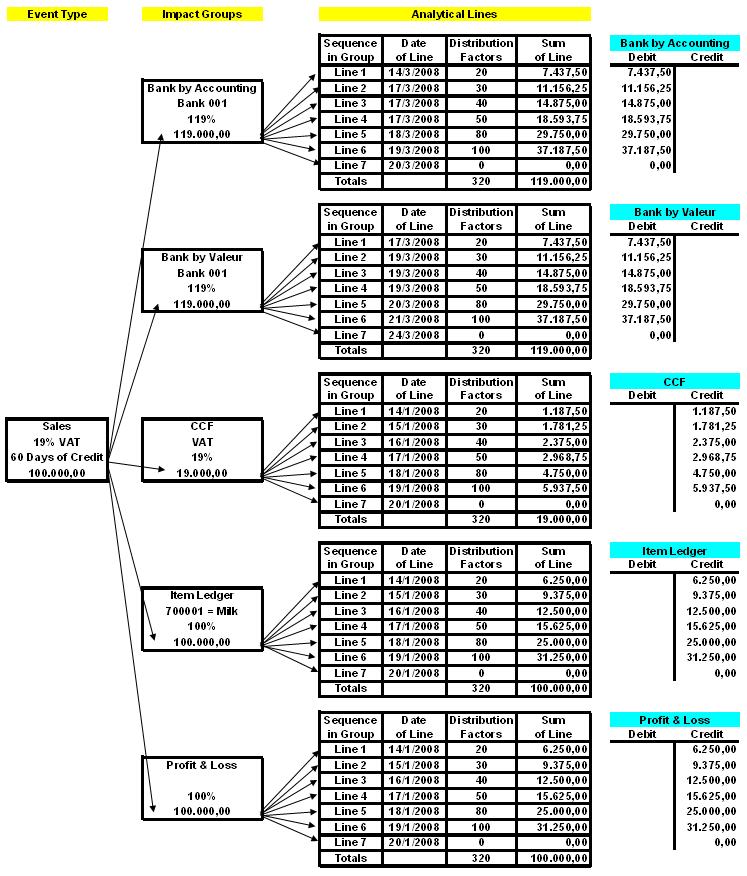
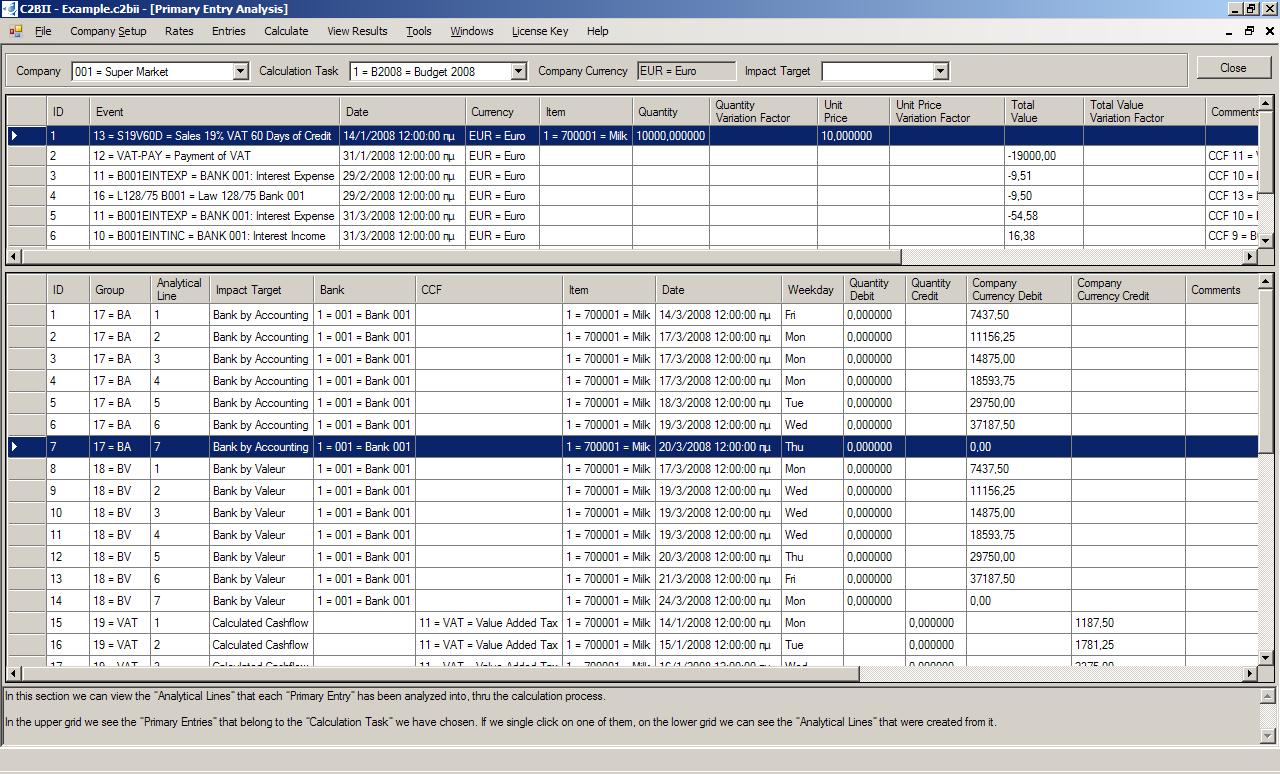
So, the end result is that for sales of week “Jan 14 of 2008” to “Jan 20 of 2008”, the following “Analytical Lines” will be created, with their respective dates and sums.
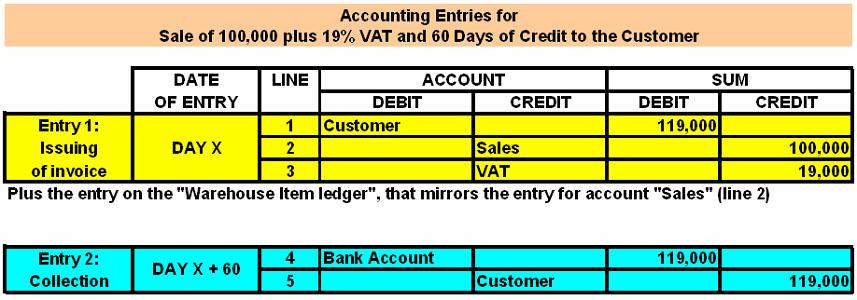
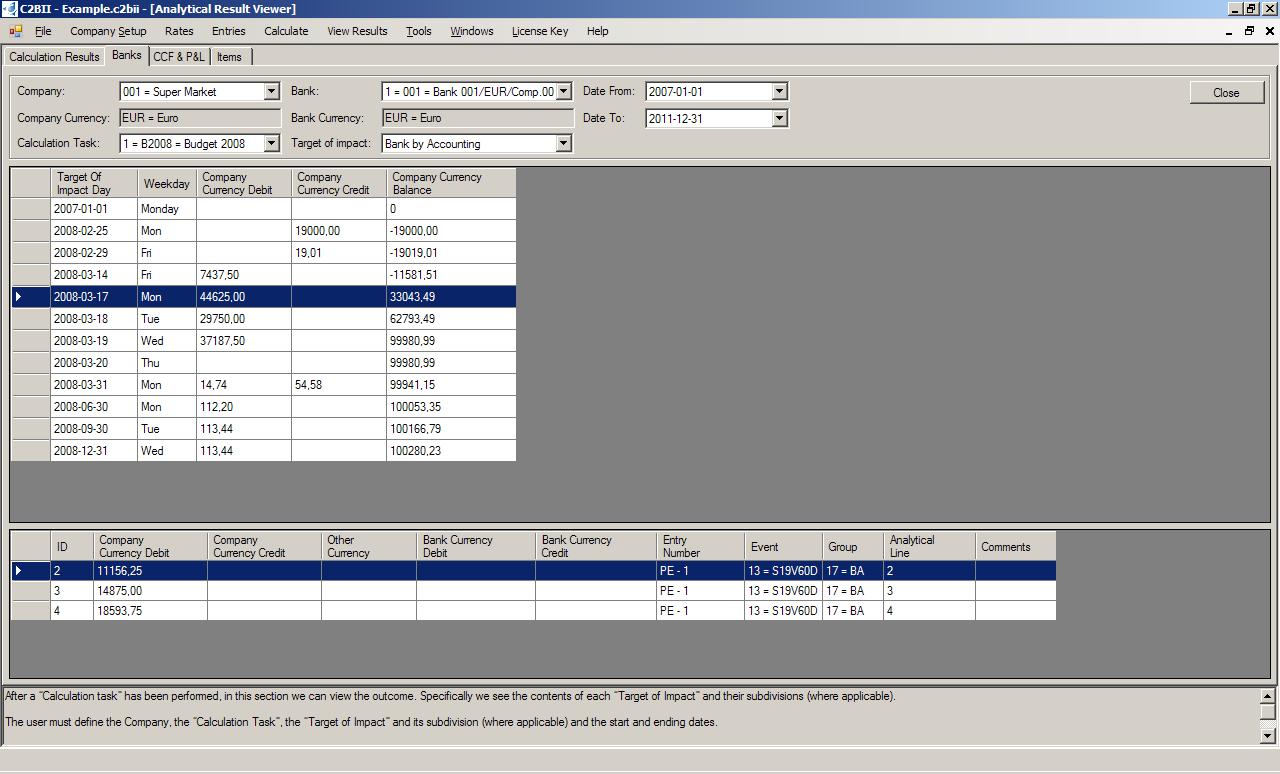
These “Analytical Lines” will populate the simulations of the company’s Accounting ledgers. Here is the simulation of the Bank account (the aspect by Accounting Balance – not the Balance by Valeur). In the diagram it is being mentioned as “Impact Group 1”. In the upper grid we see the daily totals, and in the lower grid we see the analytical movements that have created that daily total. In this example we can also see other numbers that are not included in the list, but were created automatically by the system to represent other incidents (VAT payment, Interest Income, Interest Expense etc). The mechanism that creates them automatically (Calculated CashFlows – CCF) will be discussed in later articles.
Stick around, as we are going to see the tool that handles CashFlows that will happen only if a predetermined condition has been met.




Pingback: What is the basis of the method of C2BII? Part 5: Forecasted and Calculated figures – Curing Inaccuracies and Inconsistencies | CEO on Financial Analysis